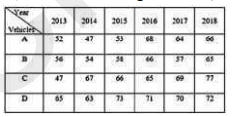
 The ratio of the total production of type A vehicles in 2013 and 2016 to the total production of type C vehicles during 2015 to 2017 is:
 A
B
C
D
Text Solution
Verified by Experts
The correct Answer is:


Similar Questions
Explore conceptually related problems
Recommended Questions
- The table given below presents the figures of the production (in thous...
Text Solution
|
- निर्देश :- निम्नलिखित ग्राफ में एक फैक्ट्री द्वारा वर्ष तक वाहन के दो ...
Text Solution
|
- The table given below presents the figures of the production (in thous...
Text Solution
|
- The table given below presents the figures of the production (in thous...
Text Solution
|
- The table shows the production of different types of cars (in thousand...
Text Solution
|
- The table shows the production of different types of cars (in thousand...
Text Solution
|
- The following table shows the production (in thousands) of different t...
Text Solution
|
- यह तालिका किसी कम्पनी द्वारा 5 वर्षो में विभिन्न प्रकार की कारों के उत...
Text Solution
|
- तालिका में विभिन्न प्रकार की कारों के उत्पादन को (हजारों में ) दर्शाया...
Text Solution
|