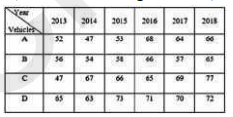
 The total production of all types of vehicles in 2018 is what percent more than the total production of all types of vehicles in 2015?
 A
B
C
D
Text Solution
Verified by Experts
The correct Answer is:


Similar Questions
Explore conceptually related problems
Recommended Questions
- The table given below presents the figures of the production (in thous...
Text Solution
|
- निर्देश :- निम्नलिखित ग्राफ में एक फैक्ट्री द्वारा वर्ष तक वाहन के दो ...
Text Solution
|
- निर्देश :- निम्नलिखित ग्राफ में एक फैक्ट्री द्वारा वर्ष तक वाहन के दो ...
Text Solution
|
- निर्देश :- निम्नलिखित ग्राफ में एक फैक्ट्री द्वारा वर्ष तक वाहन के दो ...
Text Solution
|
- The table given below presents the figures of the production (in thous...
Text Solution
|
- The table shows the production of different types of cars (in thousand...
Text Solution
|
- The following graph shows production (in thousands) of two types (P an...
Text Solution
|
- The following graph shows production (in thousands) of two types (P an...
Text Solution
|
- The following table shows the production (in thousands) of different t...
Text Solution
|