A
B
C
D
Text Solution
Verified by Experts
The correct Answer is:


Similar Questions
Explore conceptually related problems
Recommended Questions
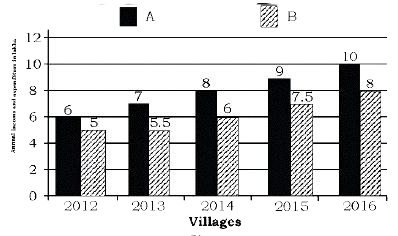
- The given bar graph presents the data of annual income and annual expe...
Text Solution
|
- Following information is available for the year 2016-17, calculate gro...
Text Solution
|
- Match the following Column A to Column B
Text Solution
|
- The inequation represented by the graph given below is : <img src="htt...
Text Solution
|
- The inequation that best describes the graph given below is <img src=...
Text Solution
|
- The inequation that best describes the following graph is <img src="h...
Text Solution
|
- The given Bar Graph presents the data of annual income (A) and annual ...
Text Solution
|
- The given bar graph presents the data of annual income and annual expe...
Text Solution
|
- The given bar graph presents the data of annual income and annual expe...
Text Solution
|