A
B
C
D
Text Solution
Verified by Experts
The correct Answer is:


Similar Questions
Explore conceptually related problems
Recommended Questions
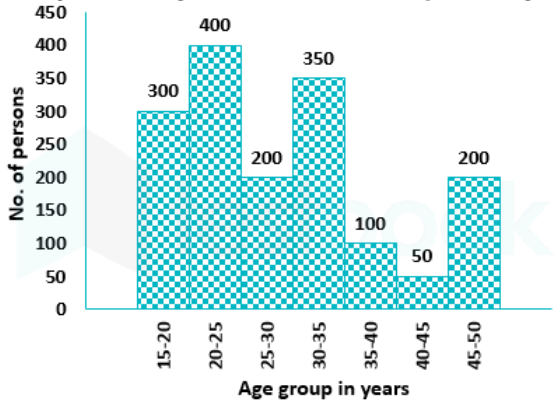
- Study the following histogram and answer the given question. A study...
Text Solution
|
- निर्देश :- निम्नलिखित हिस्टोग्राम का अध्ययन करे और दिए गए प्रश्नो का उ...
Text Solution
|
- The inequation represented by the graph given below is : <img src="htt...
Text Solution
|
- The inequation that best describes the graph given below is <img src=...
Text Solution
|
- The histogram given on the right shows the number of persons having di...
Text Solution
|
- A study was made for the number of persons of different age groups vis...
Text Solution
|
- A study was made for the number of persons of different age groups vis...
Text Solution
|
- In the given histogram, what is the mean height of all students to one...
Text Solution
|
- In the given histogram what percentage of students have height in the ...
Text Solution
|