Home
Class 12
PHYSICS
The figure denotes velocity-time graph, ...

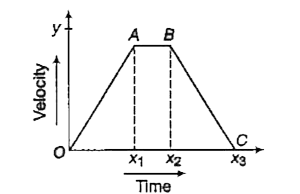
The figure denotes velocity-time graph, displace ment is equal to

A

`y (x_(1)+x_(2)+x_(3))`

B

`y(x_(3)-x_(1))`

C

`y (x_(3)-x_(2)-x_(1))`

D

`(y)/(2) (x_(3)+x_(2)-x_(1))`

Text Solution

Verified by Experts

The correct Answer is:
D

The area enclosed between velocity-time curve and the time axis gives displacement.
OABC is trapezium. Side `OC = X_(3)`, side
`AB =(x_(2)-x_(1))`
Height = y
`therefore ` Area `=(1)/(2)xx" Height "xx` (Sum of parallel side)
Area `=(1)/(2)xxyxx(x_(3)+x_(2)-x_(1))`
`therefore" Displacement "=(y)/(2) (x_(3)+ x_(2)-x_(1))`
Promotional Banner

Similar Questions

Explore conceptually related problems

Acceleration-time graph of a moving object is shown in figure. Draw the velocity- time graph and displacement-time graph corresponding to this type of motion. .

Assertion: The displacement of a body is vector sum of the area under velocity-time graph. Reason: Displacement is a vector quantity.

The figure shows a velocity-time graph of a particle moving along a straight line Q. The correct displacement-time graph of the particle is shown as

The figure shows a velocity-time graph of a particle moving along a straight line Q. The maximum of displacement of the particle is

The figure shows a velocity-time graph of a particle moving along a straight line The maximum displacement of the particle is

The figure shows a velocity-time graph of a particle moving along a straight line The maximum of displacement of the particle is

Draw the velocity-time graph for an object in uniform motion. Show that the area under the velocity-time graph gives the displacement of the object in the given time interval.

Assertion: Area under velocity-time graph give displacement. Reason: Area under acceleration-time graph give velocity.

A displacement -time graph of a body moving with uniform velocity is shown in the figure. Find out its velocity and its displacement at the end of 5 seconds

Graphs are very useful to represent a physical situation. Various quantities can be easily represented on graphs and other quantites can be determined from the graph. For example the slope of velocity-time graph represents instantaneous acceleration. For a motion with constant acceleration slope of velocity-time graph is constant. If acceleration is changing with time, slope with change and thus velocity-time graph will be a non-linear curve. Further the area of velocity-time graph gives displacement. For the given velocity-time graph the possibly correct acceleration-time relationship is