A
B
C
D
Text Solution
Verified by Experts
The correct Answer is:


ARIHANT PUBLICATION PUNJAB-DATA HANDLING AND PATTERNS-Chapter Exercise
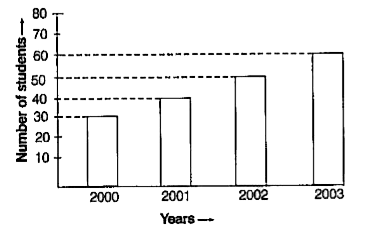
- The following bar graph shows the number of students in a particular c...
Text Solution
|
- Observe the bistogram and answer the questions given below Which ...
Text Solution
|
- Observe the bistogram and answer the questions given below Which ...
Text Solution
|
- Observe the bistogram and answer the questions given below How ma...
Text Solution
|
- Study the given bar graph carefully and answer the questions based on ...
Text Solution
|
- Study the given bar graph carefully and answer the questions based on ...
Text Solution
|
- Study the given bar graph carefully and answer the questions based on ...
Text Solution
|
- In the given bar graph, the wheat production of a farm (in tonne) from...
Text Solution
|
- Study the given information carefully and answer the questions based o...
Text Solution
|
- Study the given information carefully and answer the questions based o...
Text Solution
|
- Study the given information carefully and answer the questions based o...
Text Solution
|
- Study the following frequency distribution table and answer the questi...
Text Solution
|
- Study the following frequency distribution table and answer the questi...
Text Solution
|
- Study the following frequency distribution table and answer the questi...
Text Solution
|
- Study the following frequency distribution table and answer the questi...
Text Solution
|
- Study the following frequency distribution table and answer the questi...
Text Solution
|
- The weights (in kg) of 15 students of a class are 38, 42, 35, 37, ...
Text Solution
|
- The weights (in kg) of 15 students of a class are 38, 42, 35, 37, ...
Text Solution
|
- The weights (in kg) of 15 students of a class are 38, 42, 35, 37, ...
Text Solution
|
- The weights (in kg) of 15 students of a class are 38, 42, 35, 37, ...
Text Solution
|
- The marks (out of 100) obtained by a group of students in Science tes...
Text Solution
|