A
B
C
D
Text Solution
AI Generated Solution
The correct Answer is:


ARIHANT PUBLICATION PUNJAB-DATA HANDLING AND PATTERNS-Chapter Exercise
- The marks (out of 100) obtained by a group of students in Science tes...
Text Solution
|
- The marks (out of 100) obtained by a group of students in Science tes...
Text Solution
|
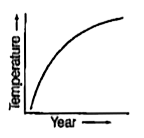
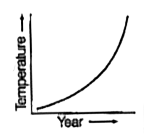
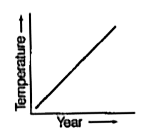
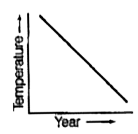
- The temperature of a particular place is continuously decreasing. Whic...
Text Solution
|
- These days, prices are falling. Which of the following graphs shows th...
Text Solution
|
- Find the next term of the following patters. Problem figures
Text Solution
|
- Find the next term of the following patters. Problem figures
Text Solution
|
- The bar graph, given here, shows the number of tickets sold by 6 stude...
Text Solution
|
- The bar graph, given here, shows the number of tickets sold by 6 stude...
Text Solution
|
- The bar graph, given here, shows the number of tickets sold by 6 stude...
Text Solution
|
- If a*b=(a b)/(a+b) , find the value of 3*(3*-1) . -3 (b) -1. 5 (c) ...
Text Solution
|
- If a * b= a^(2) + ab + b^(2), then find the value of 2 * 3?
Text Solution
|
- The following graph represents the maximum and minimum temperature rec...
Text Solution
|
- Study the following pattern 9xx9+7=88 98xx9+6=888, 987xx9+5=8888...
Text Solution
|
- Study the following pattern 9 xx 9 =81, 99 xx 99 = 9801. 999 xx 999 ...
Text Solution
|
- Which answer figure will continue the question figure series ?
Text Solution
|
- What is the value of 2+5+8+11+….+101 ?
Text Solution
|
- If in the following series, a(1)=5, a(2)= 9, a(3)=13 and so on, then f...
Text Solution
|
- Study the following graph and answer the questions given below it. N...
Text Solution
|
- Study the following graph and answer the questions given below it. N...
Text Solution
|
- Study the following graph and answer the questions given below it. N...
Text Solution
|