Home
Class 14
MATHS
'These days prices have started rising.'...

'These days prices have started rising.'' Which amongst the following graphs represents this situation?

A

B

C

D

Text Solution

AI Generated Solution

The correct Answer is:
To determine which graph represents the situation where prices have started rising, we will analyze each option step-by-step. ### Step 1: Understand the Statement The statement indicates that prices are currently rising. This means that as time progresses, the prices should show an upward trend. **Hint:** Look for a graph where the price increases as time goes on. ### Step 2: Analyze Option 1 In Option 1, the x-axis represents time, and the y-axis represents price. As time increases, the price starts low and gradually increases. This aligns with the statement that prices are rising. **Hint:** Check if the graph shows a consistent upward movement as time progresses. ### Step 3: Analyze Option 2 In Option 2, the graph shows that the price is initially increasing but then time is decreasing. This does not align with the statement since it suggests that prices are rising while time is going backward, which is not logical. **Hint:** Ensure that time is moving forward in the graph for it to represent a realistic scenario. ### Step 4: Analyze Option 3 In Option 3, the graph shows that prices increase initially but then start to decrease as time progresses. This contradicts the statement that prices are rising, as it suggests that prices eventually fall. **Hint:** Look for a graph that does not show any decline in prices over time. ### Step 5: Analyze Option 4 In Option 4, the graph indicates that as time increases, the price is actually decreasing after an initial increase. This also contradicts the statement that prices are rising. **Hint:** A graph that shows a downward trend over time cannot represent rising prices. ### Conclusion After analyzing all options, we find that **Option 1** is the only graph that accurately represents the situation where prices have started rising. **Final Answer:** The correct graph representing the situation where prices have started rising is **Option 1**.
Promotional Banner

Topper's Solved these Questions

  • DATA HANDLING AND PATTERNS

    ARIHANT PUBLICATION PUNJAB|Exercise Chapter Exercise|50 Videos
  • DATA HANDLING

    ARIHANT PUBLICATION PUNJAB|Exercise CHAPTER EXERCISE |50 Videos
  • ERROR ANALYSIS

    ARIHANT PUBLICATION PUNJAB|Exercise CHAPTER EXERCISE|25 Videos

Similar Questions

Explore conceptually related problems

The following graph represents

Which one of the following graphs represents motion?

Which of the following graph represents e^(-x) ?

Which of the following graphs represents exothoermic reaction?

Which of the following graph represents exothermic reaction ?

ARIHANT PUBLICATION PUNJAB-DATA HANDLING AND PATTERNS-Chapter Exercise
  1. If a * b= a^(2) + ab + b^(2), then find the value of 2 * 3?

    Text Solution

    |

  2. The following graph represents the maximum and minimum temperature rec...

    Text Solution

    |

  3. Study the following pattern 9xx9+7=88 98xx9+6=888, 987xx9+5=8888...

    Text Solution

    |

  4. Study the following pattern 9 xx 9 =81, 99 xx 99 = 9801. 999 xx 999 ...

    Text Solution

    |

  5. Which answer figure will continue the question figure series ?

    Text Solution

    |

  6. What is the value of 2+5+8+11+….+101 ?

    Text Solution

    |

  7. If in the following series, a(1)=5, a(2)= 9, a(3)=13 and so on, then f...

    Text Solution

    |

  8. Study the following graph and answer the questions given below it. N...

    Text Solution

    |

  9. Study the following graph and answer the questions given below it. N...

    Text Solution

    |

  10. Study the following graph and answer the questions given below it. N...

    Text Solution

    |

  11. Study the following graph and answer the questions given below it. N...

    Text Solution

    |

  12. Study the following graph and answer the questions given below it. N...

    Text Solution

    |

  13. Examine the following matchstick patterns. If the pattern continu...

    Text Solution

    |

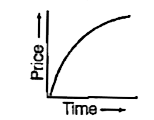
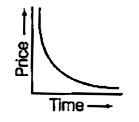
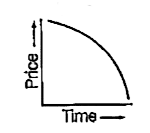
  14. 'These days prices have started rising.'' Which amongst the following ...

    Text Solution

    |

  15. If an operator oplus is defined as 4 oplus 3=4+ 5+ 6 5 oplus 4=5 +...

    Text Solution

    |

  16. Answer the following questions by selecting the most appropriate optio...

    Text Solution

    |

  17. Most appropriate formatives task to assess the students' understanding...

    Text Solution

    |

  18. Look at the following pattern: (9-1) // 8 = 1 (98-2) // 8 = 12 ...

    Text Solution

    |

  19. 13 students of class V 'A' and 15 of class V 'B' participated in a wri...

    Text Solution

    |

  20. What is te value of -1 + 2 - 3 + 4 - 5 + 6 - 7 + … + 1000 ?

    Text Solution

    |