Home
Class 14
MATHS
The following bar graph shows the number...

The following bar graph shows the number of students in a particular class of school. Then, answer the following questions.

(i) What is the nuber of students in the year 2003 ?

A

70

B

60

C

50

D

40

Text Solution

Verified by Experts

The correct Answer is:
B
Promotional Banner

Topper's Solved these Questions

  • DATA HANDLING

    ARIHANT PUBLICATION PUNJAB|Exercise CHAPTER EXERCISE |50 Videos
  • ALGEBRA

    ARIHANT PUBLICATION PUNJAB|Exercise CHAPTER EXERCISE |73 Videos
  • DATA HANDLING AND PATTERNS

    ARIHANT PUBLICATION PUNJAB|Exercise Chapter Exercise|50 Videos

Similar Questions

Explore conceptually related problems

The following bar graph shows the number of students in a particular class of school. Then, answer the following questions. What is the number of students in the year 2003?

The following bar graph shows the number of students in a particular class of school. Then, answer the following questions. What is the number of students in the year 2003?

The following bar graph shows the number of students in a particular class of school. Then, answer the following questions. Is the number of students in the year 2002 is twice that in the year 2000?

Read the adjoining bar graph showing the number of students in a particular class of a school.Answer the following questions: (a) What is the scale of this graph? (b) How many new students are added every year? (c) Is the number of students in the year 2003 twice that in the year 2000?

The following bar graph shows the number of students in different classes of a school. How many more students are there in Class IX than in Class VIII ?

The following bar graph represents the data for different sizes of shoes worn by the students in a school. Read the graph and answer the following questions. What is the number of students wearing shoe size 6?

Read the bar graph given below and answer the following questions: In which year is the number of students twice as that of 2001-02?

Read the bar graph given below and answer the following questions: In which year is the number of students maximum?

The given bar graph shows the number of students of two shools over a period of six years. In the bar graph , what is the ratio of the students taken for the years 2009 , 2011, 2013 together from school A to the students taken for the years 2008 , 2012, 2013 togther from school B ?

ARIHANT PUBLICATION PUNJAB-DATA HANDLING -CHAPTER EXERCISE
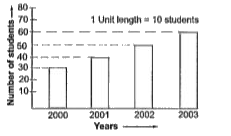
  1. The following bar graph shows the number of students in a particular c...

    Text Solution

    |

  2. Study the following information carefully and answer the questions giv...

    Text Solution

    |

  3. Study the following information carefully and answer the questions giv...

    Text Solution

    |

  4. Study the following information carefully and answer the questions giv...

    Text Solution

    |

  5. Study the following information carefully and answer the questions giv...

    Text Solution

    |

  6. Study the following information carefully and answer the questions giv...

    Text Solution

    |

  7. Study the following information carefully and answer the questions giv...

    Text Solution

    |

  8. Study the following frequency distribution table and answer the questi...

    Text Solution

    |

  9. Study the following frequency distribution table and answer the questi...

    Text Solution

    |

  10. Study the following frequency distribution table and answer the questi...

    Text Solution

    |

  11. Study the following frequency distribution table and answer the questi...

    Text Solution

    |

  12. Study the following frequency distribution table and answer the questi...

    Text Solution

    |

  13. Study the given bar chart carefully and answer the questions based on ...

    Text Solution

    |

  14. Study the given bar chart carefully and answer the questions based on ...

    Text Solution

    |

  15. Study the given bar chart carefully and answer the questions based on ...

    Text Solution

    |

  16. Observe the histogram and answer the questions given below. Whi...

    Text Solution

    |

  17. Observe the histogram and answer the questions given below. Whi...

    Text Solution

    |

  18. Observe the histogram and answer the questions given below. Ho...

    Text Solution

    |

  19. Study the given information carefully and answer the questions based o...

    Text Solution

    |

  20. Study the given information carefully and answer the questions based o...

    Text Solution

    |

  21. Study the given information carefully and answer the questions based o...

    Text Solution

    |