A
B
C
D
Text Solution
Verified by Experts
The correct Answer is:


Topper's Solved these Questions
Similar Questions
Explore conceptually related problems
ARIHANT PUBLICATION PUNJAB-DATA HANDLING -CHAPTER EXERCISE
- The marks (out of 100) obtained by a group of students in Science tes...
Text Solution
|
- The enrolment in a school during six consecutive years was as follo...
Text Solution
|
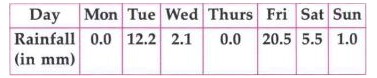
- The rainfall (in mm) in a city of 7 days of a certain week was recorde...
Text Solution
|
- Study the given information carefully and answer the questions based o...
Text Solution
|
- The rainfall (in mm) in a city on 7 days of a certain week was reco...
Text Solution
|
- For which of the following would you use a histogram to show the data...
Text Solution
|
- The temperature of a particular place is continuously decreasing, Whi...
Text Solution
|
- The median and mean values of the marks obtained by the students of a...
Text Solution
|
- If the mean and median are 25 and 28 respectively, then find the value...
Text Solution
|
- If the mean of five observations x,x +3, x+6, x+ 9 and x+ 12 is 15,...
Text Solution
|
- Mean of median, mode and range of the data 1, 2, 3, 3, 2, 5, 6, 2,...
Text Solution
|
- Study the following bar diagram and answer the question that follow. ...
Text Solution
|
- The year, in which the percentage increase in export was maximum from ...
Text Solution
|
- Study the following bar diagram and answer the question that follow. ...
Text Solution
|
- What was the percentage drop in export quantity from 2005 to 2006?
Text Solution
|
- the following examination shows the analysis of the result of an exami...
Text Solution
|
- The following examination shows the analysis of the result of an exami...
Text Solution
|
- The following examination shows the analysis of the result of an exami...
Text Solution
|
- The mean of the median, mode and range of the observations 6, 6, 9, 1...
Text Solution
|
- According to the given graph, between which two consecutive months wa...
Text Solution
|