Home
Class 14
REASONING
The procedure for the admission in the c...

The procedure for the admission in the college by the students is depicted in the Data flow diagram. After analyzing the given Data flow diagram, go through the following questions:

What step should be taken by the student if the eligibility is not met?

A

Go to the principal or concerned authority to see into the matter.

B

Report to the college and check if the eligibility norms should be relaxed.

C

If obtained the 60% marks, admission is granted.

D

Data insufficient.

Text Solution

Verified by Experts

The correct Answer is:
D

As the eligibility is fulfilled then only the further procedure is done, but if the eligibility is not fulfilled then no clear instruction is indicated, that means the data is insufficient.
Promotional Banner

Similar Questions

Explore conceptually related problems

The procedure for the admission in the college by the students is depicted in the Data flow diagram. After analyzing the given Data flow diagram, go through the following questions: What is the next step taken by the student if the test conducted by the college is not passed?

The procedure for the admission in the college by the students is depicted in the Data flow diagram. After analyzing the given Data flow diagram, go through the following questions: After which step the college should grant admission to the students?

The procedure for the admission in the college by the students is depicted in the Data flow diagram. After analyzing the given Data flow diagram, go through the following questions: What is the main condition that is not highlighted to allot the section A to the student?

The procedure for the admission in the college by the students is depicted in the Data flow diagram. After analyzing the given Data flow diagram, go through the following questions: What is the most sufficient condition to obtain an appreciation certificate?

The line graph show the number of students admitted in the given year to a certain university. Study the diagram and answer the following questions. What was the difference in admissions between the years 2016 and 2012 ?

The line graph shows the number of students admitted in the given year to a certain university. Study the diagram and answer the following questions. In which year were admissions greater that that of the previous years ?

The following bar graph represents the data for different sizes of shoes worn by the students in a school. Read the graph and answer the following questions. What is the number of students wearing shoe size 6?

Recommended Questions
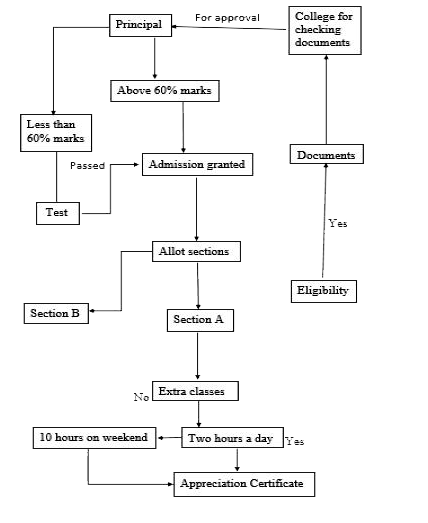
  1. The procedure for the admission in the college by the students is depi...

    Text Solution

    |

  2. क्लोरोबेंजीन की क्रिया क्यूप्रस ऑक्साइड की उपस्थिति में अमोनिया से करा...

    Text Solution

    |

  3. प्रयोगशाला में क्लोरोफॉर्म बनाने की विधि का नामांकित चित्र सहित वर्णन ...

    Text Solution

    |

  4. परिवर्ती ऑक्सीकरण अवस्थाओं से क्या तातपर्य है? इसे संक्रमण तत्वों के स...

    Text Solution

    |

  5. संलग्न चित्र में, यदि धारामापी G में कोई विक्षेप नहीं हैं तो एक दशा मे...

    Text Solution

    |

  6. प्रत्यावर्ती धरा जनित्र का सिद्धांत तथा कार्यप्रणाली चित्र द्वारा समझा...

    Text Solution

    |

  7. किसी प्रत्यावर्ती परिपथ में L ,C और R श्रेणीक्रम में जुड़े हैं ...

    Text Solution

    |

  8. L स्वप्रेरण गुणांक का प्रेरक तथा R प्रतिरोध वाले बल्ब को प्रत्...

    Text Solution

    |

  9. वाटहीन धारा का एक परिपथ आरेख खीचिए।

    Text Solution

    |