A
B
C
D
Text Solution
Verified by Experts


Recommended Questions
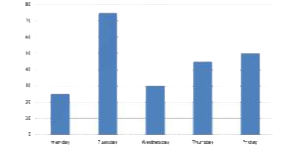
- Bar graph given below shows pens sold by a retailor on five different ...
Text Solution
|
- Ramesh bought a pen and sold it to Puneet at a profit of 20%.Puneet so...
Text Solution
|
- Shakshi bought pens at a rate of 10 pens for Rs 11and sold them at a r...
Text Solution
|
- एक कलम विक्रेता ने Rs. 5 के 6 की दर से कलम खरीदकर Rs. 3 के 4 की दर से...
Text Solution
|
- आबिदा ने 100 पेन Rs 3.50 प्रति पेन की दर से खरीदे तथा इन पर 4% बिक्री...
Text Solution
|
- Abhay sold 50 wrist watches and 30 pens. If cost of 2 wrist watches is...
Text Solution
|
- A man sold a book at 9% profit and a pen at 13% P. If the sold the boo...
Text Solution
|
- A shopkeeper purchased 300 pens and sold one out of four pens at no lo...
Text Solution
|
- A shopman bought pens at the rate of 7 for 10 and sold them at a profi...
Text Solution
|