A
B
C
D
Text Solution
Verified by Experts


Recommended Questions
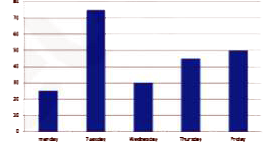
- Bar graph given below shows pens sold by a retailor on five different ...
Text Solution
|
- Cost of a dozen red pens is Rs. 108 and cost of 9 black pens is Rs.54....
Text Solution
|
- कृत्रिम उपग्रह में एक अंतरिक्ष यात्री स्याही में पेन को डुबोकर पेन में...
Text Solution
|
- कृत्रिम उपग्रह में एक अंतरिक्ष यात्री स्याही में पेन को डुबोकर पेन में...
Text Solution
|
- In this question, sentence is given with blank to be filled in with an...
Text Solution
|
- A shopkeeper purchased 300 pens and sold one out of four pens at no lo...
Text Solution
|
- A man purchased 150 pens at the rate of 12 per pen. He sold 50 pens at...
Text Solution
|
- Ink : Pen : : Blood : ?
Text Solution
|
- A pen is sold at a discount of 36.36%. If the marked price of the pen ...
Text Solution
|