A
B
C
D
Text Solution
Verified by Experts
The correct Answer is:


Recommended Questions
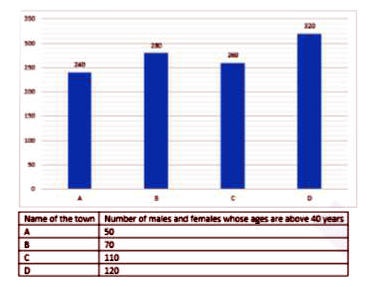
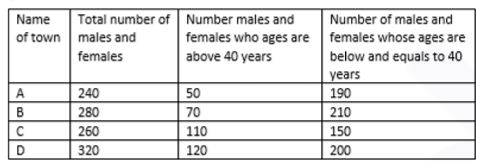
- The bar graph shows the total number of male and female lives in four ...
Text Solution
|
- in a town the population in was 8ooo in one year, male population incr...
Text Solution
|
- In a group 14 males and 6 females,8and 3 of the males and females resp...
Text Solution
|
- The inequation represented by the graph given below is : <img src="htt...
Text Solution
|
- The inequation that best describes the graph given below is <img src=...
Text Solution
|
- In a group of 14 males and 6 females, 8 and 3 of the males and the fem...
Text Solution
|
- In a town,the population was 8000.In one year,male population increase...
Text Solution
|
- The below histogram shows the number of literate females in the age gr...
Text Solution
|
- The below histogram shows the number of literate females in the age gr...
Text Solution
|