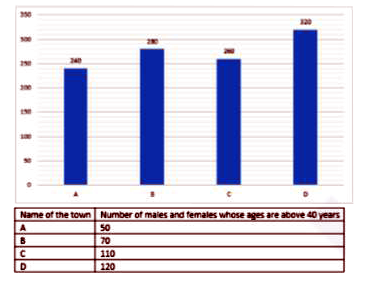
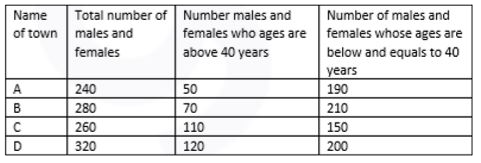
A
B
C
D
Text Solution
Verified by Experts
The correct Answer is:


Recommended Questions
- The bar graph shows the total number of male and female lives in four ...
Text Solution
|
- in a town the population in was 8ooo in one year, male population incr...
Text Solution
|
- The inequation represented by the graph given below is : <img src="htt...
Text Solution
|
- The inequation that best describes the graph given below is <img src=...
Text Solution
|
- In acertain year, the population of certain town was 9000. If in the n...
Text Solution
|
- In a town,the population was 8000.In one year,male population increase...
Text Solution
|
- 55% of the population of a town are males. If the total population ...
Text Solution
|
- The population of a certain town was 50,000. In a year, male populatio...
Text Solution
|
- एक कस्बे की जनसंख्या का 55% पुरुष है। यदि कस्बे की कुल जनसंख्या 12820...
Text Solution
|