A
B
C
D
Text Solution
Verified by Experts
The correct Answer is:


Recommended Questions
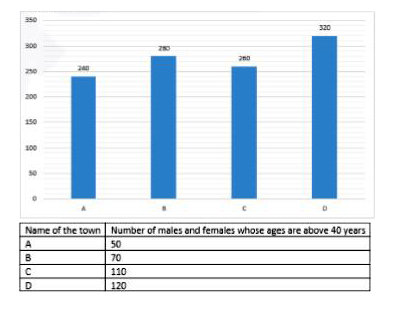
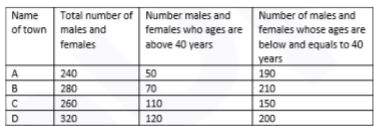
- The bar graph shows the total number of male and female lives in four ...
Text Solution
|
- in a town the population in was 8ooo in one year, male population incr...
Text Solution
|
- The population of a town is 15000. If the number of males Increases by...
Text Solution
|
- In a town,the population was 8000.In one year,male population increase...
Text Solution
|
- 55% of the population of a town are males. If the total population ...
Text Solution
|
- एक कस्बे की जनसंख्या का 55% पुरुष है। यदि कस्बे की कुल जनसंख्या 12820...
Text Solution
|
- in a town 51% There are females and there are 980 males. What was the ...
Text Solution
|
- In a town, the population was 8000. In one year, male population incre...
Text Solution
|
- The population of a town is 9000. It the number of females increases b...
Text Solution
|