A
B
C
D
लिखित उत्तर
Verified by Experts
The correct Answer is:


Recommended Questions
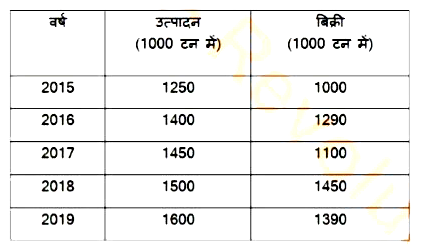
- निम्नांकित तालिका का अध्ययन करें और उसके बाद दिए गए प्रश्न का उत्तर दे...
Text Solution
|
- The following line diagram represents the yearly sales figure of a com...
Text Solution
|
- The following line diagram represents the yearly sales figure of a com...
Text Solution
|
- The following line diagram represents the yearly sales figure of a com...
Text Solution
|
- The following line diagram represents the yearly sales figure of a com...
Text Solution
|
- The following line diagram represents the yearly sales figure of a com...
Text Solution
|
- The table shows the production of different types of cars (in thousand...
Text Solution
|
- The bar graph given below shows the wheat production (in tonnes) of a ...
Text Solution
|
- The table given below shows the number of units of a product produced ...
Text Solution
|