A
B
C
D
लिखित उत्तर
Verified by Experts
The correct Answer is:


Recommended Questions
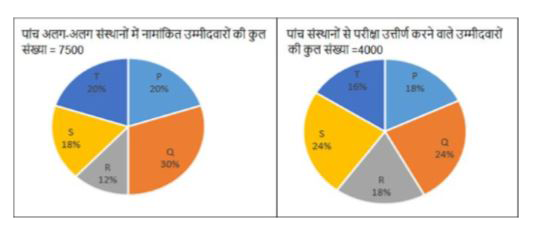
- निम्न पाई आरेख, पांच अलग-अलग संस्थानों P, Q, R, S और T से किसी प्रतियो...
Text Solution
|
- The Pie-chart given here shows the percentage of candidates selected i...
Text Solution
|
- The Pie-chart given here shows the percentage of candidates selected i...
Text Solution
|
- The Pie-chart given here shows the percentage of candidates selected i...
Text Solution
|
- The Table shows the number of students from different schools playing ...
Text Solution
|
- The given bar graph represents the number of students admitted in four...
Text Solution
|
- The given pie chart shows the percentage of students enrolled for the ...
Text Solution
|
- The following pie chart shows the percentage wise distribution of the ...
Text Solution
|
- The following graph shows the number of students (in hundreds) in thre...
Text Solution
|