A
B
C
D
लिखित उत्तर
Verified by Experts
The correct Answer is:


Recommended Questions
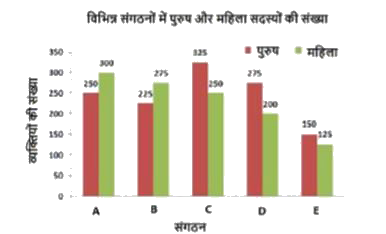
- निम्न बार ग्राफ में A, B, C, D और E विभिन्न संगठनों में पुरुष और महिला...
Text Solution
|
- Study the following bar graph and answer the questions given below. नि...
Text Solution
|
- The following bar diagram shows total number of males and females in f...
Text Solution
|
- The number of students in classes A and B are 60 and 70, respectively....
Text Solution
|
- The ratio of the number of boys in sections A and B of a class is 2 : ...
Text Solution
|
- The ratio of the number of men and women in a factory is 14: 19. If th...
Text Solution
|
- The following graph gives the details of the male and female populatio...
Text Solution
|
- The following graph shows the number of boys and girls in class V, cla...
Text Solution
|
- The following pie chart shows the percentage-wise distribution of the ...
Text Solution
|