A
B
C
D
लिखित उत्तर
Verified by Experts
The correct Answer is:


Recommended Questions
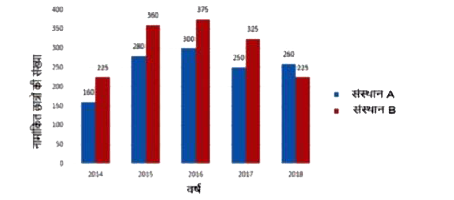
- निम्न बार ग्राफ 2014 से 2018 तक 5 वर्ष के दौरान A और B संस्थानों में व...
Text Solution
|
- यह ज्ञात है की महाविद्यालय के छात्रों में से 60 % छात्रावास में रहते ...
Text Solution
|
- The following table shows the number of students of 7 college particip...
Text Solution
|
- The number of students in classes A and B are 60 and 70, respectively....
Text Solution
|
- The table below shows the number of students enrolled in five colleges...
Text Solution
|
- The given bar graph presents the number of students from Science and A...
Text Solution
|
- The given Bar Graph presents the number of students enrolled for a voc...
Text Solution
|
- The given Bar Graph presents the number of students enrolled for a voc...
Text Solution
|
- The given Bar Graph presents Income and Expenditure (in crores of Rupe...
Text Solution
|