A
B
C
D
लिखित उत्तर
Verified by Experts
The correct Answer is:


Recommended Questions
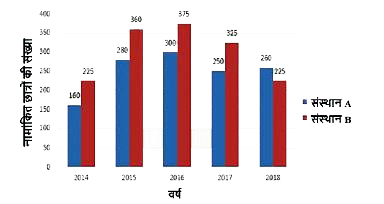
- दिया गया दंड आलेख 2014 से 2018 तक वर्षों के दौरान, A और B संस्थानों मे...
Text Solution
|
- चित्र में दिया गया वृत्त चार्ट मई -जून 2013 के दौरान वाहनों का केन्...
Text Solution
|
- चित्र में दिया गया वृत्त चार्ट मई -जून 2013 के दौरान वाहनों का केन्...
Text Solution
|
- The given bar graph presents the number of students from Science and A...
Text Solution
|
- The given Bar Graph presents the number of students enrolled for a voc...
Text Solution
|
- The given Bar Graph presents the number of students enrolled for a voc...
Text Solution
|
- The given Bar Graph presents Income and Expenditure (in crores of Rupe...
Text Solution
|
- The given Bar Graph presents the results in terms of number of student...
Text Solution
|
- The given Bar Graph presents the results in terms of number of student...
Text Solution
|