A
B
C
D
लिखित उत्तर
Verified by Experts
The correct Answer is:


Recommended Questions
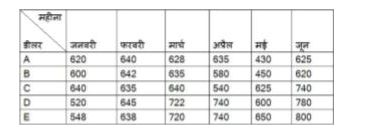
- दी गई तालिका का अध्ययन करें और प्रश्न का उत्तर दें। 2018 के पहले छह मह...
Text Solution
|
- The table shows the production of different types of cars (in thousand...
Text Solution
|
- The given pie chart shows the quantity wise sales distribution of five...
Text Solution
|
- The table shows the number of cars sold by three showrooms over a peri...
Text Solution
|
- The table shows the number of cars sold by three showrooms over a peri...
Text Solution
|
- The table given below shows the number of units of a product produced ...
Text Solution
|
- The table given below shows the number of units of a product produced ...
Text Solution
|
- The given table shows the number (in thousands) of cars of five differ...
Text Solution
|
- The given table represents the number of engineers recruited by four c...
Text Solution
|