A
B
C
D
लिखित उत्तर
Verified by Experts
The correct Answer is:


Recommended Questions
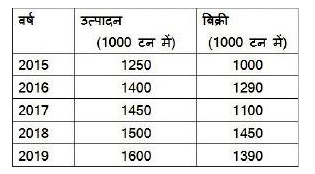
- निम्नांकित तालिका में, पांच वर्ष में किसी कंपनी के निश्चित उत्पाद का उ...
Text Solution
|
- The following line diagram represents the yearly sales figure of a com...
Text Solution
|
- The following line diagram represents the yearly sales figure of a com...
Text Solution
|
- The following line diagram represents the yearly sales figure of a com...
Text Solution
|
- The following line diagram represents the yearly sales figure of a com...
Text Solution
|
- The given Bar Graph presents the number of students of two schools for...
Text Solution
|
- The bar graph given below shows the wheat production (in tonnes) of a ...
Text Solution
|
- The table given below shows the number of units of a product produced ...
Text Solution
|
- In the following table, the production of various crops (in tonnes) is...
Text Solution
|