A
B
C
D
Text Solution
Verified by Experts
The correct Answer is:


Similar Questions
Explore conceptually related problems
Recommended Questions
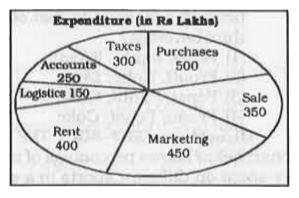
- The pie chart shows the break up of expenditure of a trading company f...
Text Solution
|
- The pie chart shows the break up of expenditure of a trading company f...
Text Solution
|
- The pie chart shows the break up of expenditure of a trading company f...
Text Solution
|
- The pie chart shows the break up of expenditure of a trading company f...
Text Solution
|
- The pie chart shows the break up of expenditure of a trading company f...
Text Solution
|
- The pie chart shows the breakup of expendoture of a manufacturing comp...
Text Solution
|
- The pie chart shows the breakup of expendoture of a software company f...
Text Solution
|
- This pie chart shows the division of expenditure of a trading company ...
Text Solution
|
- This pie chart shows the division of expenditure of a trading company ...
Text Solution
|