Home
Class 14
MATHS
The given pie chart shows information ab...

The given pie chart shows information about the mobile phone manufacturing companies in India .The total number of mobile phone units manufactures is 12, 40 , 00 units .
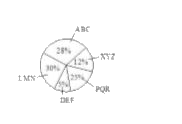
Which company produces the maximum number of mobile phone ?

A

XYZ

B

PQR

C

ABC

D

LMN

Text Solution

Verified by Experts

The correct Answer is:
D
Promotional Banner

Similar Questions

Explore conceptually related problems

The given pie chart shows information about the mobile phone manufacturing companies in India. The total number mobile phone nimfactured is 12,40,000 Which company produces the last number of mobile phones?

The given pie chart shows information about the mobile phone manufacturing companies in India. The total number of mobile phone units manufactured is 12,40,000. How many units of mobile phones wre manufactured by company 'PQR' ?

The given pie chart shows information about the mobile phone manufacturing companies in India. The total number of mobile phone units manufactured is 12, 40,000 How many units of mobile phones were manufactured by company 'LMN' ?

In 2014, which company manufactured the maximum number of laptops ?

The following pie diagram shows information about tyres manufacturing data from various companies in India during 2017. If the total tyres produced in India during 2017 was 1,80,000 units, how many units of tyres were produced by company 'D' (a)18000 (b)36000 (c)9000 (d)27000

Reading of a pie chart for the ratio of 2 mobile phones in different months

The given data shows the number of mobiles (in thousands) manufactured by companies C-1, C-2, C-3 and C-4 in 2017, 2018 and 2019. Which company manufactured the least number of mobiles across all the years?

The given data shows the number of mobiles (in thousands) manufactured by companies C-1, C-2, C-3 and C-4 in 2017, 201S and 2019. Which company manufactured the highest number of mobiles across all the years?

Study the following graph carefully and answer the question given below. The graph gives the three types of mobile phones manufactured by a company over the years. The total number of all the three types of mobiles manufactured was least in which of the following years ?