A
B
C
D
Text Solution
Verified by Experts
The correct Answer is:


Similar Questions
Explore conceptually related problems
Recommended Questions
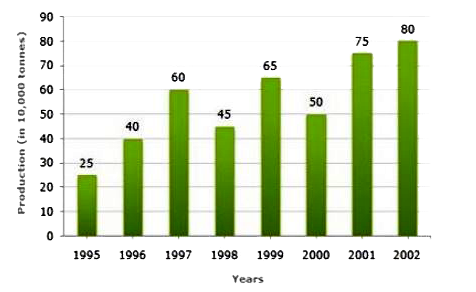
- Comprehension: Study the bar chart and answer the questions based on i...
Text Solution
|
- The value of |[a,a+d,a+2d] , [a+d,a+2d,a+3d] , [a+2d,a+3d,a+4d]|+|[b,b...
Text Solution
|
- In the given figure, PQRS is a parallelogram. A and B are the mid-poin...
Text Solution
|
- The correct order of size among Br^(+), Br, Br^(-)
Text Solution
|
- 1) Fragmentation () a) Planaria br 2) Unripe fruits () b) Yeast br 3) ...
Text Solution
|
- వేర్ల ద్వారా శాఖీయోత్పత్తి జరిపే మొక్కbr i) డాలియాbr ii) ముల్లంగ...
Text Solution
|
- In the reaction : CH(3) - underset(Br)underset(|)overset(Br)overset(|)...
Text Solution
|
- CH3 - Br + 2Na + Br - CH3 to उत्पाद, इस अभिक्रिया को कहते हैं
Text Solution
|
- Mycoplasma: br (a) Lack cell wall , br (b) Can survive without oxygen,...
Text Solution
|