A
B
C
D
Text Solution
Verified by Experts
The correct Answer is:


Similar Questions
Explore conceptually related problems
Recommended Questions
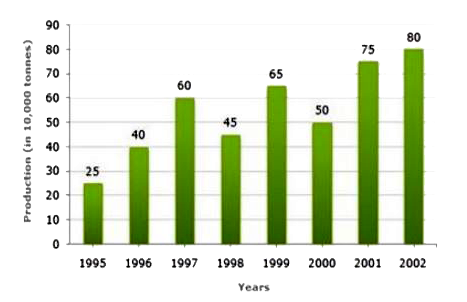
- Comprehension: Study the bar chart and answer the questions based on i...
Text Solution
|
- The value of |[a,a+d,a+2d] , [a+d,a+2d,a+3d] , [a+2d,a+3d,a+4d]|+|[b,b...
Text Solution
|
- Amongst the species Br^(-), Br, Br^(+), the smallest one in size is .
Text Solution
|
- In the given figure, PQRS is a parallelogram. A and B are the mid-poin...
Text Solution
|
- In CH(3)CH(2)Br,% of Br is
Text Solution
|
- In CH(3)CH(2)Br,% of Br is
Text Solution
|
- The correct order of size among Br^(+), Br, Br^(-)
Text Solution
|
- 1) Fragmentation () a) Planaria br 2) Unripe fruits () b) Yeast br 3) ...
Text Solution
|
- వేర్ల ద్వారా శాఖీయోత్పత్తి జరిపే మొక్కbr i) డాలియాbr ii) ముల్లంగ...
Text Solution
|