Home
Class 11
MATHS
The scores of 48 children in an intellig...

The scores of 48 children in an intelligence test are shown in the following :
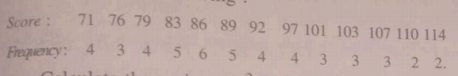
Calculate the variance `sigma^2` and find out the percentage of children whose scores lie between `bar x- sigma` and `bar x+sigma` .

Promotional Banner

Topper's Solved these Questions

  • STATISTICS

    MODERN PUBLICATION|Exercise EXERCISE|98 Videos
  • SETS

    MODERN PUBLICATION|Exercise EXERCISE|381 Videos
  • STRAIGHT LINES

    MODERN PUBLICATION|Exercise EXERCISE|304 Videos

Similar Questions

Explore conceptually related problems

A metal bar AB can slide on two parallel thick metallic rails separated by a distance l. A resistance R and an inductance L are connected to the rails as shown in the figure. A long straight wire carrying a constant current I_(0) is placed in the plane of the rails and perpendicular to them as shown. The bar AB is held at rest at a distance x_(0) from the long wire. At t=0, it is made to slide on the rails away from wire. Answer the following questions. Find a relation among i, (di)/(dt) and (d phi)/(dt) , where i is the current in the circuit and phi is the flux of the megnetic field due to the long wire through the circuit.

A small coil is positionaed so that its axis lies along the axis of a large bar agnet, as shown in the figure. The coil has a cross-sectional area of 0.40 cm^2 and contains 150 turns of wire. The average magnetic flux density B through the coil aries with the distance x between the face of the magnet and the plane of the coil as shown in the figure. The coil is 5.0 cm from the face of the magnet to determine the magnetic flux density in the coil.

Find mu, sigma_x^2 and sigma_x for the following probability distributions: .

Find mu, sigma_x^2 and sigma_x for the following probability distributions: .

Find mu, sigma_x^2 and sigma_x for the following probability distributions: .

Find mu, sigma_x^2 and sigma_x for the following probability distributions: .

The scores of 10 students in a test, in which the maximum marks Were 50 as follows : 28, 36, 34, 28, 48, 22, 35, 27, 19, 41. Find the Variance.

Given that bar x is the mean and sigma^2 is the variance of n observations x_1, x_2, ... x_n . Prove that the mean and variance of the observations ax_1, ax_2, ... ,ax_n , are a bar x and a^2 sigma^2 respectively (a ne 0) .

If bar x is the mean and Mean Deviation from mean is MD (bar x) , then find the number of observations lying between bar x- MD (bar x) and bar x+ MD (bar x) from the following data : 22, 24, 30, 27, 29, 31, 25, 28, 41, 42.

Given that bar x is the mean and sigma^2 is the variance of n observations x_1 , x_2 ,.... x_n . Prove that the mean and variance of the observations ax_1, ax_2, ax_3 ,......, ax_n are a bar x and a^2 sigma^2 , respectively, (a ne 0) .

MODERN PUBLICATION-STATISTICS-EXERCISE
  1. The scores of 10 students in a test, in which the maximum marks Were 5...

    Text Solution

    |

  2. Later on the maximum marks were increased to 100, and accordingly each...

    Text Solution

    |

  3. The scores of 48 children in an intelligence test are shown in the fol...

    Text Solution

    |

  4. A sample of 25 variates has mean 40 and standand deviation 5 and a sec...

    Text Solution

    |

  5. The mean of 5 observation is 4.4 and their variance is 8.24. If three ...

    Text Solution

    |

  6. The mean and variance of 7 observations are 8 and 16 respectively. If ...

    Text Solution

    |

  7. The mean and standard deviation of 6 observations are 8 and 4, respect...

    Text Solution

    |

  8. Calculate the standard deviation of the following frequency distributi...

    Text Solution

    |

  9. Calculate the standard deviation of the following frequency distributi...

    Text Solution

    |

  10. Following is the distribution of the number of out-door patients regis...

    Text Solution

    |

  11. Calculate the standard deviation of the following distribution :

    Text Solution

    |

  12. Calculate the mean and standard deviation for the following distributi...

    Text Solution

    |

  13. Calculate the mean and standard deviation for the following distributi...

    Text Solution

    |

  14. Calculate the mean and standard deviation for the following distributi...

    Text Solution

    |

  15. Calculate the mean and standard deviation for the following distributi...

    Text Solution

    |

  16. Calculate the mean and standard deviation for the following distributi...

    Text Solution

    |

  17. Calculate the mean and standard deviation for the following distributi...

    Text Solution

    |

  18. In a study of patients, following data are obtained. Find the arithmet...

    Text Solution

    |

  19. Calculate the mean and variance of the following data :

    Text Solution

    |

  20. Calculate the mean and variance of the following data :

    Text Solution

    |