


Topper's Solved these Questions
Similar Questions
Explore conceptually related problems
MODERN PUBLICATION-STATISTICS-EXERCISE
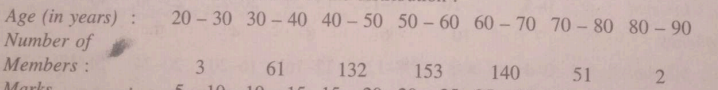
- Calculate the mean and standard deviation of the distribution :
Text Solution
|
- Calculate the mean and standard deviation of the distribution :
Text Solution
|
- Calculate the mean and standard deviation of the distribution :
Text Solution
|
- Calculate the mean and standard deviation of the distribution :
Text Solution
|
- Calculate the mean and standard deviation of the following distributio...
Text Solution
|
- Calculate the mean and standard deviation of the following distributio...
Text Solution
|
- Find the mean , variance and standard deviation :
Text Solution
|
- In a survey of 950 families in a village, the following distribution o...
Text Solution
|
- The diameters of circles (in mm) drawn in a design are given below : ...
Text Solution
|
- From the data given below, state which group is more variable :
Text Solution
|
- In a study to test the effectiveness of new variety of seeds, an exper...
Text Solution
|
- The weights of a group of children at 6 month are given below: Find...
Text Solution
|
- In the study of 79 diabetic patients, the following data are obtained....
Text Solution
|
- Two plants A and B of a factory show following results about the numbe...
Text Solution
|
- The following values are calculated in respect of heights and weights ...
Text Solution
|
- The sum and sum of squares corresponding to length x (in cm) and weigh...
Text Solution
|
- From the data given below, state which group is more variable, A or B ...
Text Solution
|
- From the prices of shares X and Y below, find out which is more stable...
Text Solution
|
- The following is the record of goals scored by team A in a football se...
Text Solution
|
- The mean of first 11 terms of Fibonacci sequence : 1,1,2, 3, 5, 8, 13,...
Text Solution
|