Home
Class 11
MATHS
The following values are calculated in r...

The following values are calculated in respect of heights and weights of the students of a section of class XI.
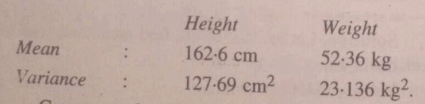
Can we say that the weights show greater variation than the heights?

Promotional Banner

Topper's Solved these Questions

  • STATISTICS

    MODERN PUBLICATION|Exercise EXERCISE|98 Videos
  • SETS

    MODERN PUBLICATION|Exercise EXERCISE|381 Videos
  • STRAIGHT LINES

    MODERN PUBLICATION|Exercise EXERCISE|304 Videos

Similar Questions

Explore conceptually related problems

The means and standard deviations of heights and weights of 50 students of a class are as follows : Which shows more variability, heights or weights ?

Consider the following frequency distribution table representing the weights of 40 students of a class . Draw a histogram to represent the above data.

Following number lines shows the temperature in degree celsius (^@C) at different places on a particular day. Can we say temperature of Srinagar and Shimla taken together is less than the temperature at Shimla? Is it also less than the temperture at Srinagar?

In nature, the failure of structural members usually result from large torque because of twisting or bending rather than due to tensile or compressive strains. This process of structural breakdown is called buckling and in cases of tall cylindrical structureslike trees, the torque is caused by its own weight bending the structure. Thus the vertical through the centre of gravity does not fall within the base. The elastic torque caused because of this bending about the central axis of the tree is given by (Ypir^4)/(4R) . Y is the Young's modulus, r is the radius of the trunk and R is the radius of curvature of the bent surface along the height of the tree containing the centre of gravity (the neuttral surface). EStimate the critical height of a tree for a given radius of the trunk.

Diameter of cylinder A is 7 cm, and the height is 14 cm. Diameter of cylinder B is 14 cm and height is 7 cm. Without doing any calculations can you suggest whose volume is greater? Verify it by finding the volume of both the cylinders. Check whether the cylinder with greater volume also has greater surface area?

Diameter of cylinder A is 7 cm, and the height is 14 cm.Diameter of cylinder B is 14 cm an height is 7 cm.Without doing any calculations can you suggest whose volume is greater ?Verify it by finding the volume of both the cylinders.Check whether the cylinder with greater volume also has greater surface area?

A curved surface is shown in the figure. The portion BCD is free of friciton. There are three spherical balls of identical radii and masses. Balls are released from rest one by one from A which is at a slightly greater height than C. With the surface AB, ball 1 has large enough firction to cause rolling down without slipping, ball 2 has a small friction and ball 3 has a negligible frction. Which balls (s) can reach D?

The heights of 50 students, measured to the nearest centimetres have been found to be as follows : : What can you conclude about their heights from the table ?

MODERN PUBLICATION-STATISTICS-EXERCISE
  1. From the data given below, state which group is more variable :

    Text Solution

    |

  2. In a study to test the effectiveness of new variety of seeds, an exper...

    Text Solution

    |

  3. The weights of a group of children at 6 month are given below: Find...

    Text Solution

    |

  4. In the study of 79 diabetic patients, the following data are obtained....

    Text Solution

    |

  5. Two plants A and B of a factory show following results about the numbe...

    Text Solution

    |

  6. The following values are calculated in respect of heights and weights ...

    Text Solution

    |

  7. The sum and sum of squares corresponding to length x (in cm) and weigh...

    Text Solution

    |

  8. From the data given below, state which group is more variable, A or B ...

    Text Solution

    |

  9. From the prices of shares X and Y below, find out which is more stable...

    Text Solution

    |

  10. The following is the record of goals scored by team A in a football se...

    Text Solution

    |

  11. The mean of first 11 terms of Fibonacci sequence : 1,1,2, 3, 5, 8, 13,...

    Text Solution

    |

  12. If each of the observations x1, x2, ....xn is increased by an amount ‘...

    Text Solution

    |

  13. Find the mean and standard deviation for the following data :

    Text Solution

    |

  14. Find the average earnings (using step-deviation method) and the standa...

    Text Solution

    |

  15. The yields of wheat for 50 experimental fields are given below. Find t...

    Text Solution

    |

  16. The mean and standard deviation of marks obtained by 50 students of a ...

    Text Solution

    |

  17. From a frequency distribution consisting of 18 observations, the mean ...

    Text Solution

    |

  18. The mean and standard deviation of 20 observations are found to be 10 ...

    Text Solution

    |

  19. The mean and standard deviation of 20 observations are found to be 10 ...

    Text Solution

    |

  20. The mean and standard deviation of a group of 100 observations were fo...

    Text Solution

    |