Home
Class 11
MATHS
The mean and standard deviation of marks...

The mean and standard deviation of marks obtained by 50 students of a class in three subjects- Mathematics, Physics and Chemistry are given below :
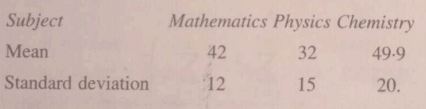
Which of the three subjects shows the highest variability in marks and which shows the lowest ?

Promotional Banner

Topper's Solved these Questions

  • STATISTICS

    MODERN PUBLICATION|Exercise EXERCISE|98 Videos
  • SETS

    MODERN PUBLICATION|Exercise EXERCISE|381 Videos
  • STRAIGHT LINES

    MODERN PUBLICATION|Exercise EXERCISE|304 Videos

Similar Questions

Explore conceptually related problems

The means and standard deviations of heights and weights of 50 students of a class are as follows : Which shows more variability, heights or weights ?

There are 20 students in a Chemistry class and 30 students in a Physics class. Find the number of students which are either in Physics class or Chemistry class in the following case : the two classes meet at different hours and ten students are rolled in both the subjects.

Consider the marks out of 100, obtained by 51 students of a class in a test, given in table below: Draw a historigram and frequency polygon for the above data.

A class has 175 students. The following is the description showing the number of students studying one or more of following subjects in this class. Mathematics 100 , Physics 70, Chemistry 46, Mathematics and Physics 30, Mathematics and Chemistry 28, Physics and Chemistry 23, Mathematics, Physics and Chemistry 18 : Find : the number of students who are enrolled in Mathematics alone, Physics alone and Chemistry alone .

In a survey of 25 students, it was found that 15 had taken Mathematics, 12 had taken Physics and 11 had taken Chemistry, 5 had takes Mathematics and Chemistry, 9 had taken Mathematics and Physics, 4 had taken Physics and Chemistry and 3 had taken all three subjects. Find the number of students that had taken : Mathematics and Physics but not Chemistry.

Marks obtained by a student in six diferent subjects is depicted by the adjacent graph .Study the graph and answer tw2he following questions . What is different between the highest and the lowest scores ?

The marks obtained of a class of 80 students are given below Construct a histogram to represent the data above.

In a survey of 200 students of a school, it was found that 120 study Mathematics, 90 study Physics and 70 study Chemistry , 40 study Mathematics and Physics, 30 study Physics and Chemistry, 50 study Chemistry and Mathematics and 20 none of these subjects. Find the number of students who study all the three subjects.

Marks obtained by a student in six diferent subjects is depicted by the adjacent graph .Study the graph and answer tw2he following questions . What are the highest and the lowest marks scored by the sudent and which subject ?

A class has 175 students. The following table shows the number of students studying one or more of the following subjects in this case. How many students are enrolled in Mathematics alone, Physics alone and Chemistry alone? Are there students who have not offered any one of these subjects?

MODERN PUBLICATION-STATISTICS-EXERCISE
  1. From the data given below, state which group is more variable :

    Text Solution

    |

  2. In a study to test the effectiveness of new variety of seeds, an exper...

    Text Solution

    |

  3. The weights of a group of children at 6 month are given below: Find...

    Text Solution

    |

  4. In the study of 79 diabetic patients, the following data are obtained....

    Text Solution

    |

  5. Two plants A and B of a factory show following results about the numbe...

    Text Solution

    |

  6. The following values are calculated in respect of heights and weights ...

    Text Solution

    |

  7. The sum and sum of squares corresponding to length x (in cm) and weigh...

    Text Solution

    |

  8. From the data given below, state which group is more variable, A or B ...

    Text Solution

    |

  9. From the prices of shares X and Y below, find out which is more stable...

    Text Solution

    |

  10. The following is the record of goals scored by team A in a football se...

    Text Solution

    |

  11. The mean of first 11 terms of Fibonacci sequence : 1,1,2, 3, 5, 8, 13,...

    Text Solution

    |

  12. If each of the observations x1, x2, ....xn is increased by an amount ‘...

    Text Solution

    |

  13. Find the mean and standard deviation for the following data :

    Text Solution

    |

  14. Find the average earnings (using step-deviation method) and the standa...

    Text Solution

    |

  15. The yields of wheat for 50 experimental fields are given below. Find t...

    Text Solution

    |

  16. The mean and standard deviation of marks obtained by 50 students of a ...

    Text Solution

    |

  17. From a frequency distribution consisting of 18 observations, the mean ...

    Text Solution

    |

  18. The mean and standard deviation of 20 observations are found to be 10 ...

    Text Solution

    |

  19. The mean and standard deviation of 20 observations are found to be 10 ...

    Text Solution

    |

  20. The mean and standard deviation of a group of 100 observations were fo...

    Text Solution

    |