


Similar Questions
Explore conceptually related problems
ICSE MODEL PAPER-SAMPLE PAPER 2022-SECTION B
- Construct a triangle ABC, with AB = 7 cm, BC = 8 cm and angleABC=60^(@...
Text Solution
|
- Construct a triangle ABC, with AB = 6 cm, BC = 7 cm and angleABC = 60^...
Text Solution
|
- Mr. A. Ramchander has an account with Central Bank of India. The foll...
Text Solution
|
- Prove that 1/(secx-tanx)+1/(secx+tanx)=2/(cosx)
Text Solution
|
- In the figure given below, CD is the diameter of the circle which meet...
Text Solution
|
- Prove that A(2, 1), B(0,3) and C(-2,1) are the three vertices of an ...
Text Solution
|
- A fair dice is rolled. Find the probability of getting 3 on the fa...
Text Solution
|
- A fair dice is rolled. Find the probability of getting an odd numb...
Text Solution
|
- A fair dice is rolled. Find the probability of getting a number ...
Text Solution
|
- A (4,2), B(6,8) and C (8,4) are the vertices of a triangle ABC. Write ...
Text Solution
|
- The angle of elevation of an aeroplane from a point P on the ground is...
Text Solution
|
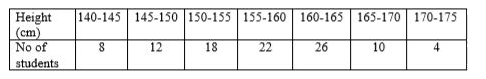
- The following table shows the distribution of the heights of a group o...
Text Solution
|
- The following table shows the distribution of the heights of a group o...
Text Solution
|
- The following table shows the distribution of the heights of a group o...
Text Solution
|
- The manufacturer sold a TV to a wholesaler for Rs.7000. The wholesaler...
Text Solution
|
- The manufacturer sold a TV to a wholesaler for Rs.7000. The wholesaler...
Text Solution
|
- In the diagram given below, equation of AB is x-sqrt3y+1=0 and equatio...
Text Solution
|
- In the diagram given below, equation of AB is x-sqrt3y+1=0 and equatio...
Text Solution
|
- In the figure given below, O is the center of the circle. Chord CD is ...
Text Solution
|
- Construct a triangle ABC, given that AB = 6 cm, BC = 5.6cm and AC = 6....
Text Solution
|