A
B
C
D
Text Solution
Verified by Experts


Similar Questions
Explore conceptually related problems
Recommended Questions
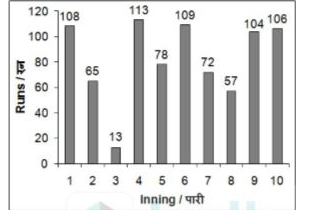
- The bar chart given below shows the runs scored by a batsman in 10 di...
Text Solution
|
- किसी बल्लेबाज का 40 पारीयो का औसत 50 रन है। बल्लेबाज का अधिक्तम स्कोर...
Text Solution
|
- How many lines of symmetry does the above figure have ? <img src="http...
Text Solution
|
- Determine the point of symmetry of a regular hexagon. <img src="htt...
Text Solution
|
- Dtermine the images of the following figure about the given line : ...
Text Solution
|
- Match the following Column A to Column B
Text Solution
|
- Match the following Column A to Column B
Text Solution
|
- Match the following Column A to Column B
Text Solution
|
- .The runs scored by a batsman in seven innings are as follows: (a) Fin...
Text Solution
|