A
B
C
D
Text Solution
Verified by Experts
The correct Answer is:


Similar Questions
Explore conceptually related problems
Recommended Questions
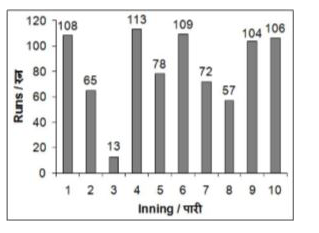
- The bar chart given below shwos the runs scored by a bastsman in 10 di...
Text Solution
|
- A batsman scored the following number of runs in six innings:36, 35, ...
Text Solution
|
- A cricketer has a mean score of 60 runs in 10 innings. Find out how ma...
Text Solution
|
- A cricketer scored some runs in his continuous 9 innings. He scored 10...
Text Solution
|
- The average score of Dhoni after 48 innings is 48 and in the 49th inni...
Text Solution
|
- The average score of Sehwag in 10 innings was 77 runs. In the 11^(th) ...
Text Solution
|
- একজন ক্রিকেট খেলোয়াড়ের বিগত 20 টি ইনিংসের রান নিচে দেওয়া হল। এক পরি...
Text Solution
|
- A batsman scored the following number of runs in six innings: 36,35,...
Text Solution
|
- The batting average for 40 innings of a cricket player is 50 runs. ...
Text Solution
|