A
B
C
D
Text Solution
Verified by Experts
The correct Answer is:


Similar Questions
Explore conceptually related problems
Recommended Questions
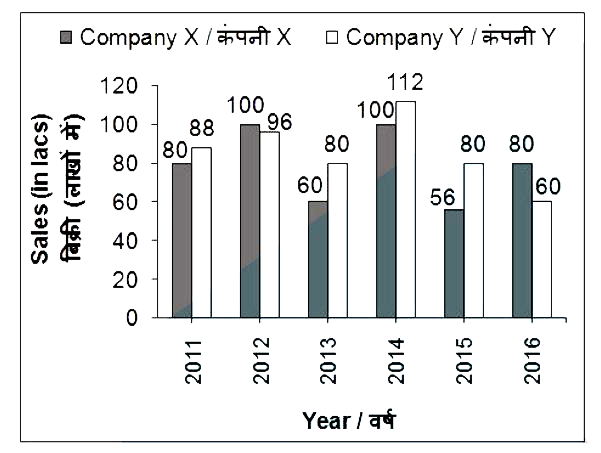
- The bar chart given below shows the sales (in lacs) of 2 companies X ...
Text Solution
|
- Match the following Column A to Column B
Text Solution
|
- The inequation represented by the graph given below is : <img src="htt...
Text Solution
|
- The inequation that best describes the graph given below is <img src=...
Text Solution
|
- There are two car manufacturing companies (Company X and Company Y). T...
Text Solution
|
- The given bar chart shows the sales of books in four metro branches of...
Text Solution
|
- The line chart given below shows the sales (in crores) of company A an...
Text Solution
|
- The bar chart given below shows the sales ( in crores ) of company P f...
Text Solution
|
- The bar chart given below shows the sales ( in crores ) of company P f...
Text Solution
|