


Similar Questions
Explore conceptually related problems
Recommended Questions
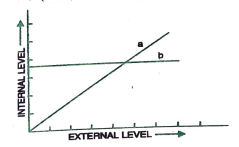
- The following graph represents the organismic response to certain envi...
Text Solution
|
- Which one of the following depicts the graph of an odd function?
Text Solution
|
- (a) The graph given below represents the organisms response to tempera...
Text Solution
|
- The graph given below represents the organisms reponse to temperature ...
Text Solution
|
- Which of the following graphs best depicts the changes in one cycle of...
Text Solution
|
- दिया गया त्वरण-समय ग्राफ निम्न में से किस भौतिक स्थिति को दर्शाता है?
Text Solution
|
- निम्न में से कौन सा ग्राफ एन्जाइम की उपस्थिति (+ के द्वारा दर्शाई गई) ...
Text Solution
|
- (a) The graph given below represents the organisms response to temper...
Text Solution
|
- Given below is a graph depicting organismic response to changing exter...
Text Solution
|