


Similar Questions
Explore conceptually related problems
Recommended Questions
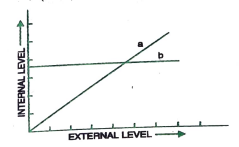
- The following graph represents the organismic response to certain envi...
Text Solution
|
- (a) The graph given below represents the organisms response to tempera...
Text Solution
|
- The graph given below represents the organisms reponse to temperature ...
Text Solution
|
- निम्न ग्राफों का ढलान क्या प्रदर्शित करता है? (i)स्थिति-समय ग्राफ, (...
Text Solution
|
- What does this graph not represent a function ?
Text Solution
|
- किसी अभिक्रिया को हम निम्न ग्राफ के द्वारा दर्शा सकते हैं बताइए Q इसमे...
Text Solution
|
- a. What does the graph represent ? b.What is the importance of this gr...
Text Solution
|
- किसी कार की गति के लिए दूरी - समय ग्राफ एक वक्र रेखा है । यह ग्राफ क्य...
Text Solution
|
- (a) The graph given below represents the organisms response to temper...
Text Solution
|