


Similar Questions
Explore conceptually related problems
Recommended Questions
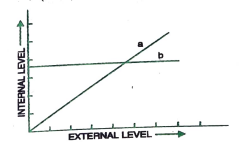
- The following graph represents the organismic response to certain envi...
Text Solution
|
- The given graph represents how three different living organisms (X,Y a...
Text Solution
|
- The response of different organisms to environmental rhythms of light ...
Text Solution
|
- (a) The graph given below represents the organisms response to tempera...
Text Solution
|
- To which category of cells do the B-cells and T-cells belong? How do t...
Text Solution
|
- The graph given below represents the organisms reponse to temperature ...
Text Solution
|
- How do primary sex organs, and secondary sex organs differ from each o...
Text Solution
|
- (a) The graph given below represents the organisms response to temper...
Text Solution
|
- The given graph represents how three different living organisms (X,Y a...
Text Solution
|