


Similar Questions
Explore conceptually related problems
Recommended Questions
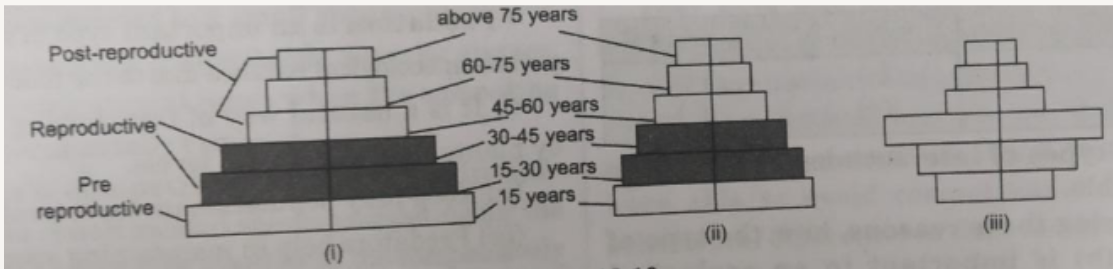
- Study the 3 representative figure of age pyramid relating to human pop...
Text Solution
|
- Study the 3 representative figures of age pyramid relating to human po...
Text Solution
|
- The age pyramid for human population is shown below Which of the ...
Text Solution
|
- What type of human population is represented by the following age pyra...
Text Solution
|
- निम्नलिखित आयु पिरामिड द्वारा मानव जनसंख्या का कौन - सा प्रकार प्र...
Text Solution
|
- What type of human population is represented by the following age pyra...
Text Solution
|
- Study the three representatives figures of age pyramid relating two hu...
Text Solution
|
- Study the three representatives figures of age pyramid relating two hu...
Text Solution
|
- Study the three representatives figures of age pyramid relating two hu...
Text Solution
|