


Similar Questions
Explore conceptually related problems
Recommended Questions
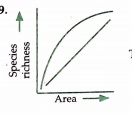
- The above graph shows species Area relationship. Write the equations o...
Text Solution
|
- Which option correctly describes the equations for curves A and B, in ...
Text Solution
|
- The hyperbolic equation for the species area relationship is
Text Solution
|
- The given graph shows species-area relationship. Write the equation of...
Text Solution
|
- The above graph show Species-Area relationship. Write the equation of ...
Text Solution
|
- Describe species-area relationship on log scale.
Text Solution
|
- Which option correctly describes the equation for curves A and B, in t...
Text Solution
|
- The above graph show Species-Area relationship. Write the equation of ...
Text Solution
|
- Which option correctly describes the equation for curves A and B, in t...
Text Solution
|