


Similar Questions
Explore conceptually related problems
Recommended Questions
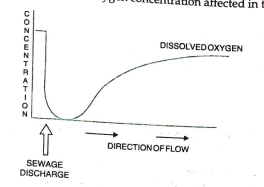
- Study the graph given below. Explain how is oxygen concentration affec...
Text Solution
|
- The graph given below represents the effect of sewage discharge on som...
Text Solution
|
- How can sewage discharge affect the aquatic creature ?
Text Solution
|
- वाहित मल ( सीवेज) के नदी में विसर्जन से होने वाले प्रभावों पर टिप...
Text Solution
|
- Study the graph given below. Explain how is oxygen concentration affec...
Text Solution
|
- Why does the oxygen concentration in the water decrease when sewae is ...
Text Solution
|
- The graph given below represents the effect of sewage discharge on som...
Text Solution
|
- Explain the effect on the characteristics of a river when urban sewage...
Text Solution
|
- Study the graph given below. Explain how is oxygen concentration affec...
Text Solution
|