Home
Class 14
MATHS
These questions are based on the followi...

These questions are based on the following graphs :
Details of statewise distribution of candidates appeard in an examination.
Total appeared candidates = 1,00,000


Ratio of Male and female candidates appeared

What is the total number of male candidates appeared in the examination from state B and C together ?

A

A) 30000

B

B) 25000

C

C) 15000

D

D) 20000

Text Solution

Verified by Experts

The correct Answer is:
D
Promotional Banner

Topper's Solved these Questions

  • DATA INTERPRETATION

    MAHENDRA|Exercise EXERCISE |75 Videos
  • BOAT & STREAM

    MAHENDRA|Exercise EXERCISE|25 Videos
  • DATA SUFFICIENCY

    MAHENDRA|Exercise Exercise |40 Videos

Similar Questions

Explore conceptually related problems

These questions are based on the following graphs : Details of statewise distribution of candidates appeard in an examination. Total appeared candidates = 1,00,000 Ratio of Male and female candidates appeared What is the respective ratio of the number of male candidates appeared in the examination from state A to that from state E ?

These questions are based on the following graphs : Details of statewise distribution of candidates appeard in an examination. Total appeared candidates = 1,00,000 Ratio of Male and female candidates appeared The total number of female candidates appeared from state D and F together is what percent of the total number of candidates appeared in the examination from all the states ?

These questions are based on the following graphs : Details of statewise distribution of candidates appeard in an examination. Total appeared candidates = 1,00,000 Ratio of Male and female candidates appeared The number of female candidates appeared from state E is what percent of the total number of candidates appeared in the examination from all the states ?

These questions are based on the following graphs : Details of statewise distribution of candidates appeard in an examination. Total appeared candidates = 1,00,000 Ratio of Male and female candidates appeared The number of female candidates appeared from state C is double to the number of male candidates appeared in the examination from which state ?

In an examination 74% of the candidates passed and 156 failed. The candidates who appeared in the examination were

Number of candidates passing the exam from city F is what percent of the total number of candidates appearing from all the cities together?

The number of candidates appearing for the exam from city C is what percent of the number of candidates appearing for the exam from city B ?

Study the following table and answer questions: Number of candidates appeared in an examination from five cities: The number of candidates appearing for the examination from city D is what percent of the total number of candidates failed in cities A and B?

MAHENDRA-DATA INTERPRETATION -EXERCISE
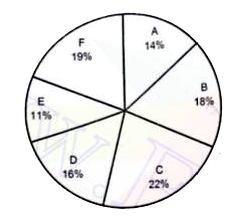
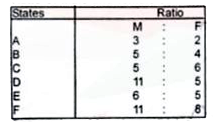
  1. These questions are based on the following graphs : Details of state...

    Text Solution

    |

  2. Study the following graph carefully and answer the question given belo...

    Text Solution

    |

  3. Study the following graph carefully and answer the question given belo...

    Text Solution

    |

  4. Study the following graph carefully and answer the question given belo...

    Text Solution

    |

  5. Study the following graph carefully and answer the question given belo...

    Text Solution

    |

  6. Study the following graph carefully and answer the question given belo...

    Text Solution

    |

  7. Ready the following graph carefully and answer the questions given bel...

    Text Solution

    |

  8. Ready the following graph carefully and answer the questions given bel...

    Text Solution

    |

  9. Ready the following graph carefully and answer the questions given bel...

    Text Solution

    |

  10. Read the following graph carefully and answer the questions given belo...

    Text Solution

    |

  11. Read the following graph carefully and answer the questions given belo...

    Text Solution

    |

  12. Read the following graph carefully and answer the questions given belo...

    Text Solution

    |

  13. Read the following graph carefully and answer the questions given belo...

    Text Solution

    |

  14. If 85% of the S type cars produced in each year were sold by the compa...

    Text Solution

    |

  15. Read the following graph carefully and answer the questions given belo...

    Text Solution

    |

  16. Read the following graph carefully and answer the questions given belo...

    Text Solution

    |

  17. Ready the following graph carefully and answer the questions given bel...

    Text Solution

    |

  18. Ready the following graph carefully and answer the questions given bel...

    Text Solution

    |

  19. Ready the following graph carefully and answer the questions given bel...

    Text Solution

    |

  20. Ready the following graph carefully and answer the questions given bel...

    Text Solution

    |

  21. Ready the following graph carefully and answer the questions given bel...

    Text Solution

    |