A
B
C
D
Text Solution
Verified by Experts
The correct Answer is:


Topper's Solved these Questions
Similar Questions
Explore conceptually related problems
MAHENDRA-TEST PAPER - 10-MULTIPLE CHOICE QUESTIONS
- Study the table carefully to answer the questions that follow :- Num...
Text Solution
|
- Number of men visiting Super-market D from approximtely what percent o...
Text Solution
|
- Number of children visiting Super-market C from what percet of number ...
Text Solution
|
- What is the total number of children visiting Super-markets B and D to...
Text Solution
|
- What is the average number of women visiting all the Super-markets tog...
Text Solution
|
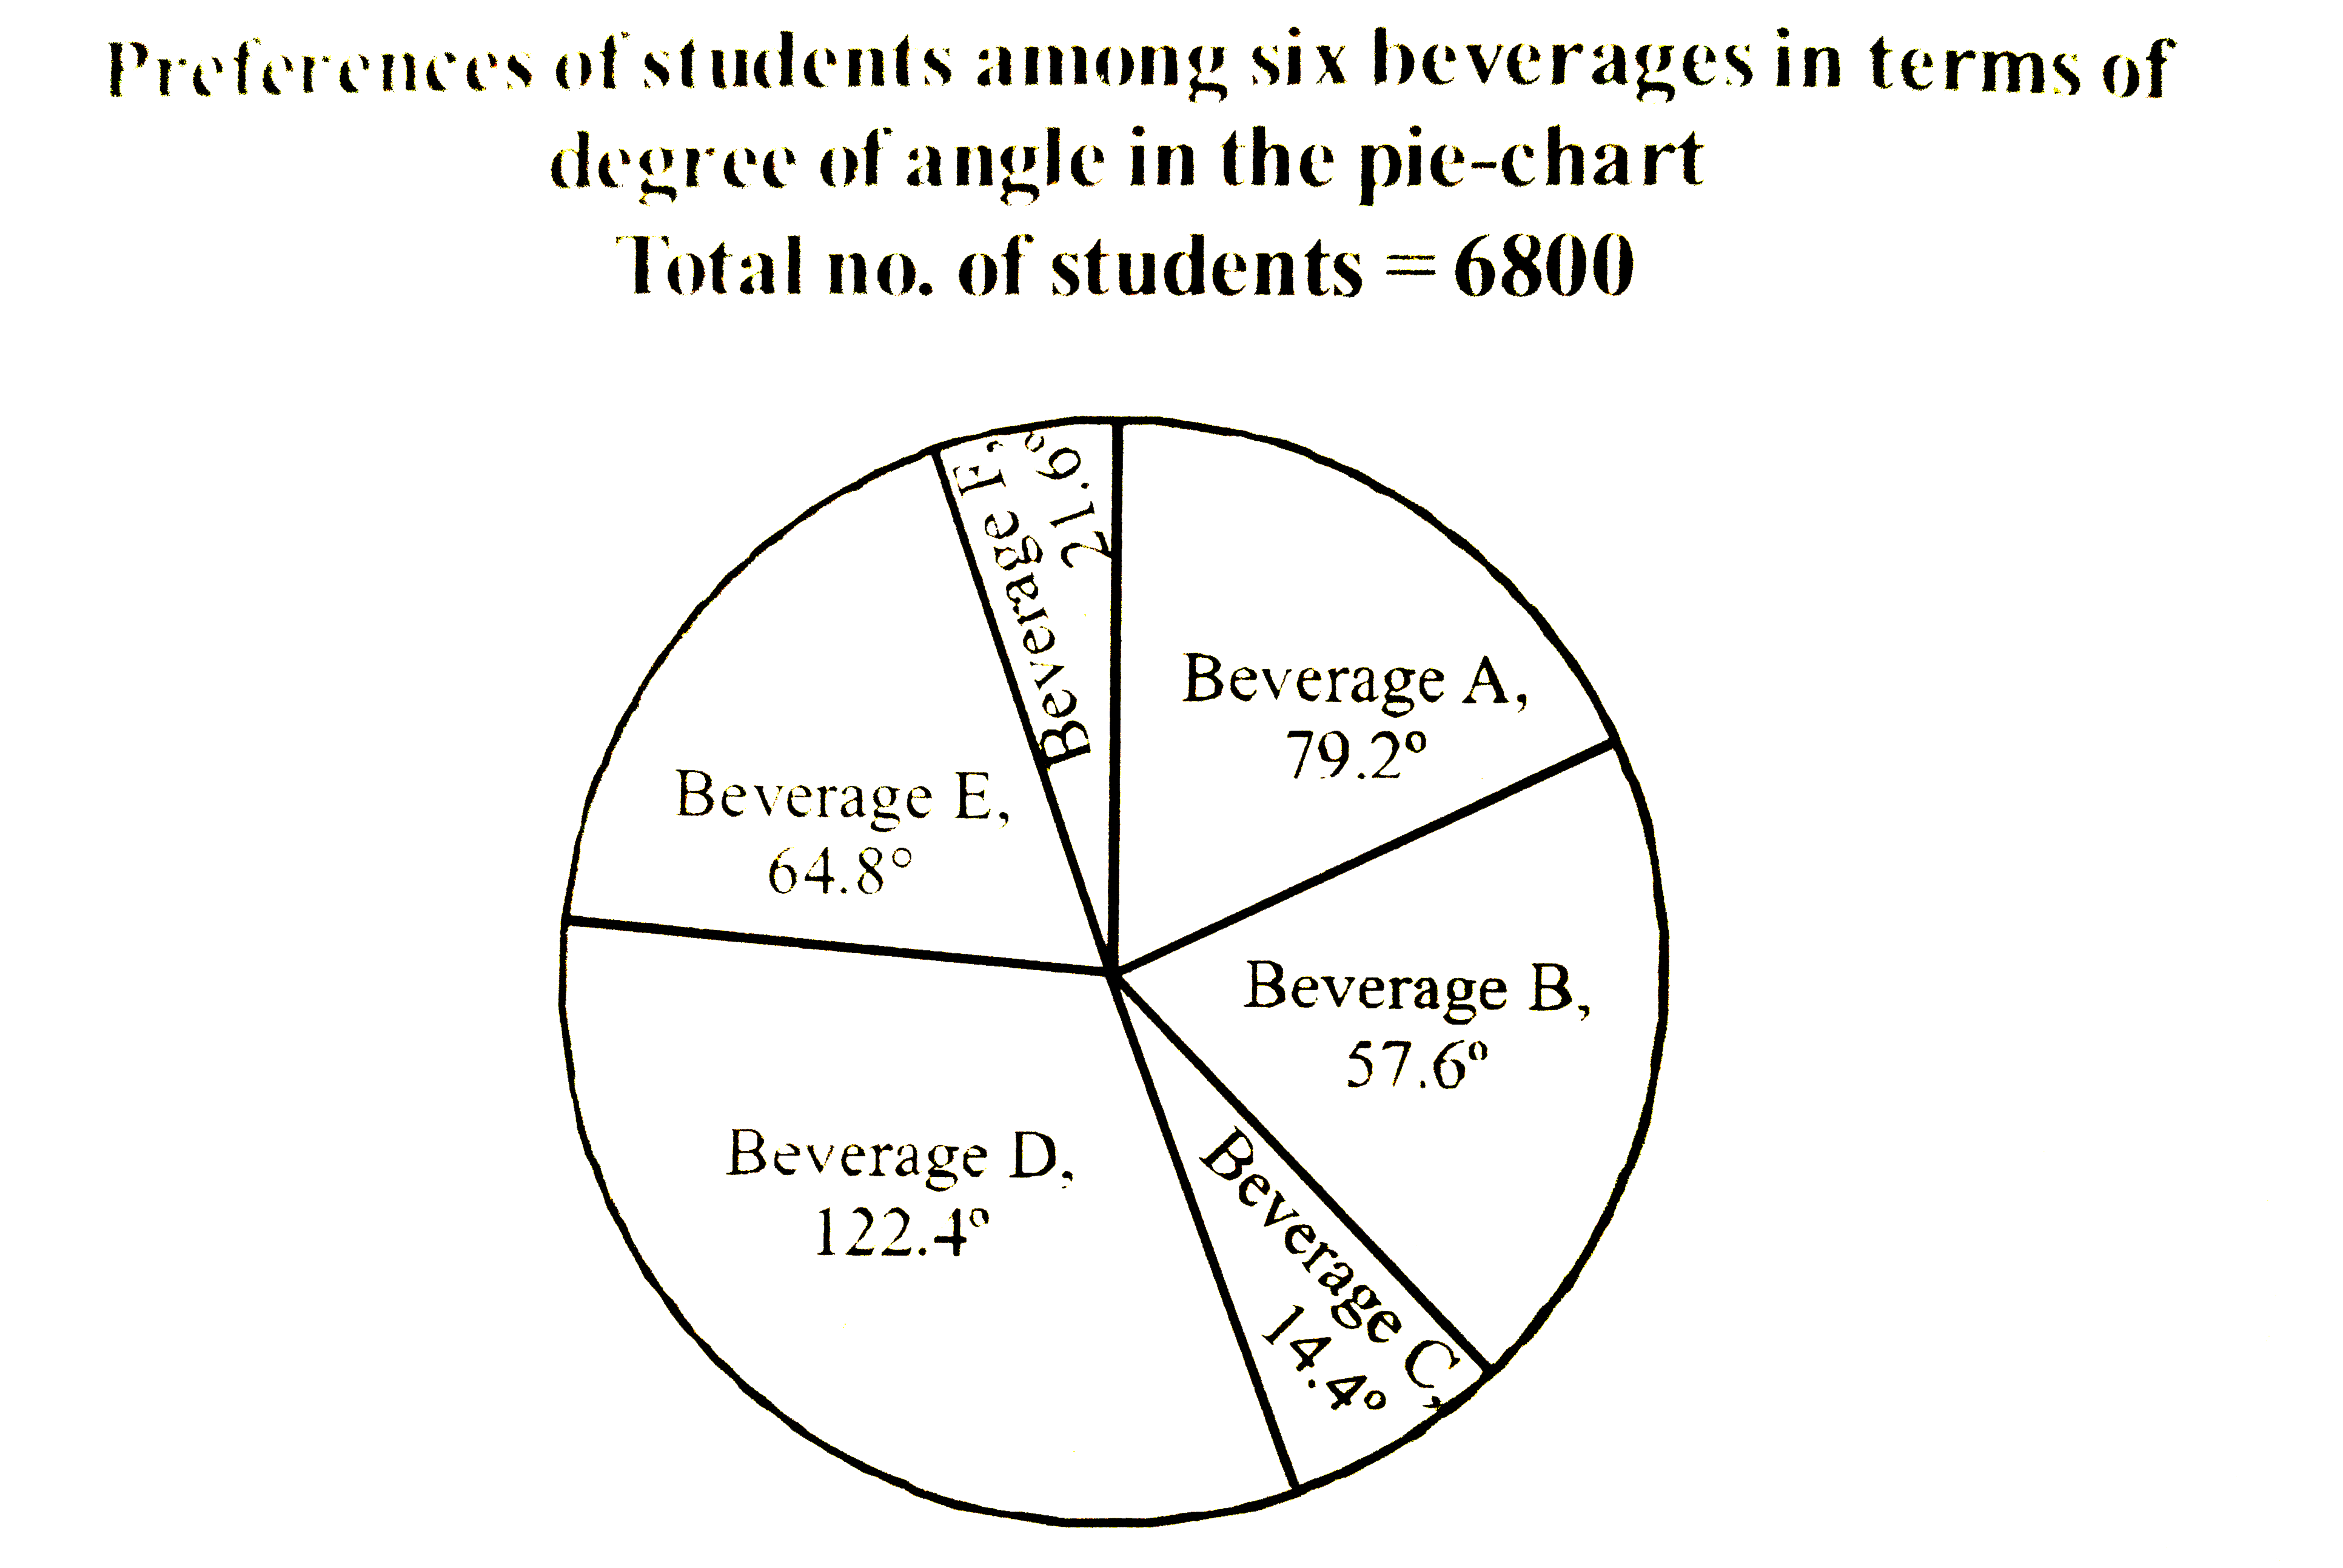
- Study the following pie-chart and answer the questions given below : ...
Text Solution
|
- Study the following pie-chart and answer the questions given below : ...
Text Solution
|
- What is the differene between the total number of students who prefer ...
Text Solution
|
- The number of students who prefer Beverage E and F together we what pe...
Text Solution
|
- What is the respective ratio between the number of students who prefer...
Text Solution
|
- Study the table carefully to answer the questions that follow : Perc...
Text Solution
|
- Who has scored the highest total marks in the all the subjects togeth...
Text Solution
|
- Marks obtained bu Garvita in Brand Management are what percent of mark...
Text Solution
|
- How many students have scored the highest marks in more than one subje...
Text Solution
|
- What are the average marks obtained by all students together in compen...
Text Solution
|
- Study the following graph and answer the questions given below : No....
Text Solution
|
- Study the following graph and answer the questions given below : No....
Text Solution
|
- Study the following graph and answer the questions given below : No....
Text Solution
|
- Study the following graph and answer the questions given below : No....
Text Solution
|
- Study the following graph and answer the questions given below : No....
Text Solution
|