A
B
C
D
लिखित उत्तर
Verified by Experts
The correct Answer is:


Recommended Questions
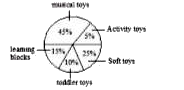
- निम्न पाई चार्ट "XYZ" कंपनी द्वारा बनाए गए खिलौनों की वर्ष 2017-18 के ...
Text Solution
|
- The following line diagram represents the yearly sales figure of a com...
Text Solution
|
- The following line diagram represents the yearly sales figure of a com...
Text Solution
|
- The following line diagram represents the yearly sales figure of a com...
Text Solution
|
- The income of A is 25% more than that of B and the income of C is 65% ...
Text Solution
|
- The income of A is 50% more than that of B. If the income of A is incr...
Text Solution
|
- If the income of A is 24% less than income of B, then what percentage ...
Text Solution
|
- If A’s income is 40% more than the income of B, then what percentage o...
Text Solution
|
- Rita.s income is 15% less than Richa.s income. By what percent is Rich...
Text Solution
|