A
B
C
D
Text Solution
Verified by Experts
The correct Answer is:


Similar Questions
Explore conceptually related problems
Recommended Questions
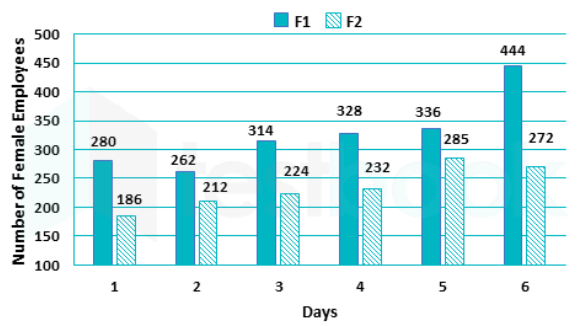
- The Bar graph given below presents the number of female employees work...
Text Solution
|
- 12% of the employees in a factory are females and the number of mal...
Text Solution
|
- एक फैक्टरी में प्रत्येक 9 कर्मचारियों में से एक महिला कर्मचारी है। यदि...
Text Solution
|
- Match the following Column A to Column B
Text Solution
|
- The inequation represented by the graph given below is : <img src="htt...
Text Solution
|
- The inequation that best describes the graph given below is <img src=...
Text Solution
|
- The inequation that best describes the following graph is <img src="h...
Text Solution
|
- In an increases of 40% is made in the average number of female employe...
Text Solution
|
- एक फैक्ट्री में 80% पुरुष कर्मचारी हैं जिनमें से 20% मैट्रिक व शेष ग्र...
Text Solution
|