A
B
C
D
Text Solution
Verified by Experts
The correct Answer is:


Similar Questions
Explore conceptually related problems
Recommended Questions
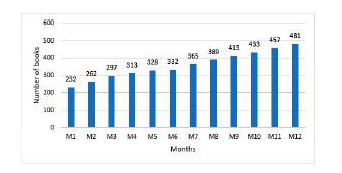
- The Bar graph given below presents the number of books sold by a books...
Text Solution
|
- Match the following Column A to Column B
Text Solution
|
- The inequation represented by the graph given below is : <img src="htt...
Text Solution
|
- The inequation that best describes the graph given below is <img src=...
Text Solution
|
- The inequation that best describes the following graph is <img src="h...
Text Solution
|
- Total number of books sold on Tuesday are 25% more than total number o...
Text Solution
|
- किसी पुस्तक विक्रेता द्वारा पाँच लगातार वर्षों में बेचे गए पुस्तकों की...
Text Solution
|
- Read the bar graph which shows the number of books sold by a bookstore...
Text Solution
|
- The bar graph given below presents the number of books sold by a books...
Text Solution
|