A
B
C
D
Text Solution
Verified by Experts


Similar Questions
Explore conceptually related problems
Recommended Questions
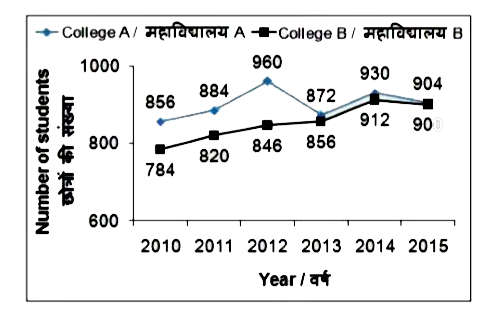
- The line chart given below shows the number of students who have taken...
Text Solution
|
- Study the following table and answer the following Average number of ...
Text Solution
|
- The following table shows the number of students in five colleges in t...
Text Solution
|
- The bar chart given below shows the number of staff in college A and B...
Text Solution
|
- The bar chart given below shows the number of staff in college A and B...
Text Solution
|
- निम्नलिखित तालिका में पिछले पाँच वर्षो ( 2010 से 2014 ) में पाँच कॉलेज...
Text Solution
|
- निम्नलिखित तालिका में पिछले पाँच वर्षो ( 2010 से 2014 ) में पाँच कॉलेज...
Text Solution
|
- The following table shows the last five years ( 2010 From 2014 ) shows...
Text Solution
|
- The following table shows the last five years ( 2010 From 2014 ) shows...
Text Solution
|