A
B
C
D
Text Solution
Verified by Experts
The correct Answer is:


SSC SELECTION POST-SSC SELECTION POST (6 NOV 2020) SHIFT 3 HSC-SECTION : QUANTITATIVE APTITUDE
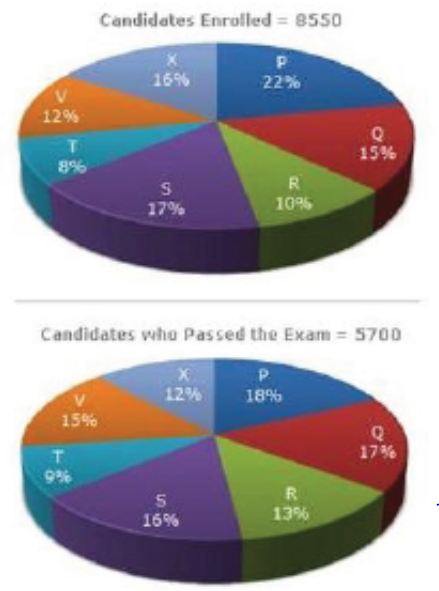
- The following the pie chart represent the distrubution of candidates w...
Text Solution
|
- On selling a television at a 6% profit and a frtidge at a 9% profit, a...
Text Solution
|
- In Delta ABC BC bot AC at D.E is a point on BC such that angle BEA = x...
Text Solution
|
- A 540 m long train, running at a uniform speed, crosses a platfrom in ...
Text Solution
|
- The average of n observation is 40. If two observation of 50 and 60 ar...
Text Solution
|
- Two employes A and B are paid a total of Rs. 13,455 per week by their ...
Text Solution
|
- The given pie chart shows the percentage distribution of the expenditu...
Text Solution
|
- In triangle ABC ,AD is the bisector of angle A,meets BC at D. If BC = ...
Text Solution
|
- The given bar graph shows the number of tourists of various states. S...
Text Solution
|
- A person sold an article at a loss of 8% Had he sold it at a grain of ...
Text Solution
|
- A sports store offers a 10% discount on its goods. The store offers a ...
Text Solution
|
- If x^(4) - 3x^(2) - 1 = 0, then the value of (x^(6)-3x^(2)+(3)/(x^(2))...
Text Solution
|
- A circle circumscribes a rectangle whose sides are in the ratio of 4 :...
Text Solution
|
- If the value of (a + b - 3)^(2) + (b + c- 2)^(2) + (c + a - 5)^(2) =...
Text Solution
|
- If 14331433 xx 1422 xx 1425 is divided by 12, then what is the remain...
Text Solution
|
- If decreasing 70 by x% yields the same result as increasing 60 by x%, ...
Text Solution
|
- A person invested a sum of Rs. 25,000 partly at 10% per annum simple i...
Text Solution
|
- X and Y together can finish a task in 12 days. If Y alone can finish t...
Text Solution
|
- If 2cos^(2)theta-5costheta+2=0,0^(@)ltthetalt90^(@) then the value of ...
Text Solution
|
- Eight years ago, the ratio of the ages of A and B was 9 :10. The ratio...
Text Solution
|