A
B
C
D
Text Solution
Verified by Experts
The correct Answer is:


SSC SELECTION POST-SSC SELECTION POST 10 NOV 2020 SHIFT 2 HSC LEVEL-QUANTITATIVE APTITUDE
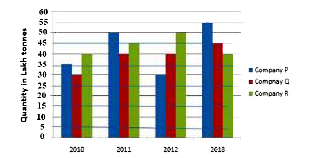
- The bar graph given below shows the data of the production of paper (i...
Text Solution
|
- Which among the following can be expressed as (10p + q) (10q + p), whe...
Text Solution
|
- If (a + b - c) : ( b + c - a) : (a + c - b) = 6 : 5 : 7, then (1)/(a)...
Text Solution
|
- If a + b + c = 6, a^(2) + b^(2) + c^(2) = 30 and a^(3) + b^(3) + c^(3)...
Text Solution
|
- 12 men and 16 women can complete a jon in 5 days. 13 men and 24 women ...
Text Solution
|
- If a nine-digit number 43x1145y2 is divisible by 88, then the value of...
Text Solution
|
- A vender bought 40 dozen fruits for Rs 3,000. Out of these, 30 fruits ...
Text Solution
|
- A is 20% more than B, B is 25% more than C, C is 50% less than D and D...
Text Solution
|
- If x is subtracted from each of the numbers 20, 37, 54 and 105, then t...
Text Solution
|
- The following pie diagram gives the marks scored by a student in diffe...
Text Solution
|
- In a press, there are three types of printing machines, P, Q and R. Ma...
Text Solution
|
- If sin theta sec^(2) theta = (2)/(3), 0^(@) lt theta lt 90^(@), then ...
Text Solution
|
- The bar graph given below shows the data of the production of paper (i...
Text Solution
|
- The parallel sides fo a trapezium are 30 cm and 20 cm and its non-para...
Text Solution
|
- An article is marked at a price that is 20% more than its cost price. ...
Text Solution
|
- The sides AB and AC of triangle ABC are produced to points D and E, re...
Text Solution
|
- The average marks obtained by 240 students in a certain examination is...
Text Solution
|
- The average weight of the students in a group was 75.4 kg. Later on, f...
Text Solution
|
- A sum of Rs 95 amounts to Rs 105 in 3 years at a certain rate of simpl...
Text Solution
|
- A person takes 40 minutes more than his usual time when he covers a di...
Text Solution
|