A
B
C
D
Text Solution
Verified by Experts
The correct Answer is:


Similar Questions
Explore conceptually related problems
Recommended Questions
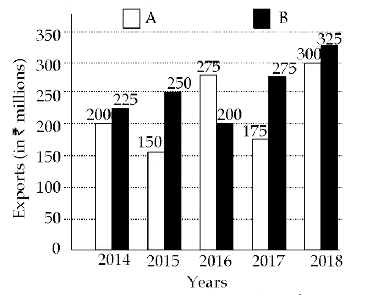
- The bar graph shows the exports of Cars of Type A and B The total...
Text Solution
|
- The bar graph shows the exports of Cars of Type A and B (in Rs million...
Text Solution
|
- The bar graph shows the exports of Cars of Type A and B (in ₹ millions...
Text Solution
|
- The bar graph shows the exports of Cars of Type A and B In which year,...
Text Solution
|
- What is the ratio of the total exports of cars of type A in 2014 and 2...
Text Solution
|
- The bar graph shows the exports of Cars of Type A and B The total...
Text Solution
|
- Study the graph and answer the question In which year, were the e...
Text Solution
|
- Study the graph and answer the question The exports of type A car...
Text Solution
|
- The table shows the production of different types of cars. (in thousan...
Text Solution
|